RXR
project description
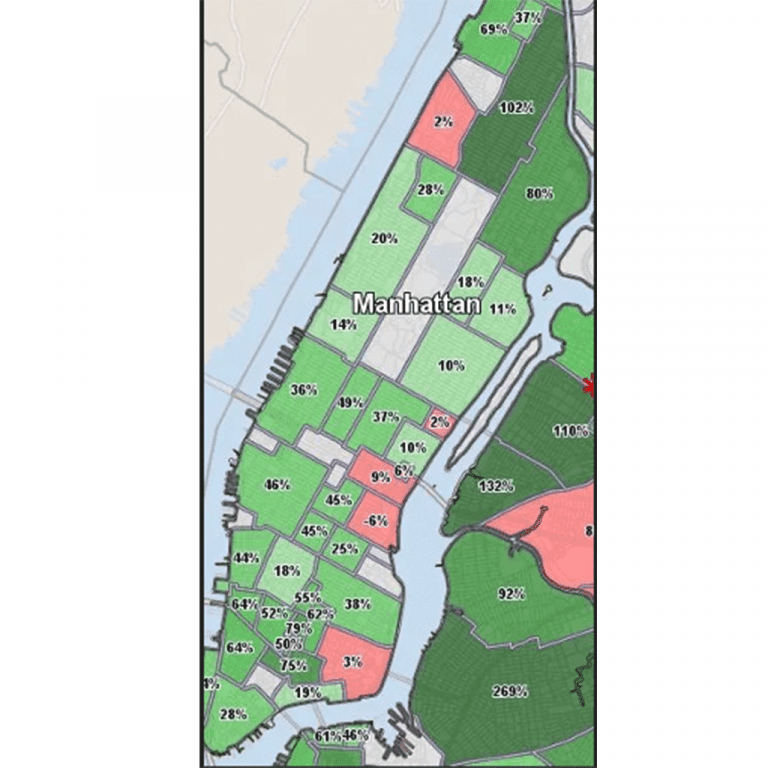
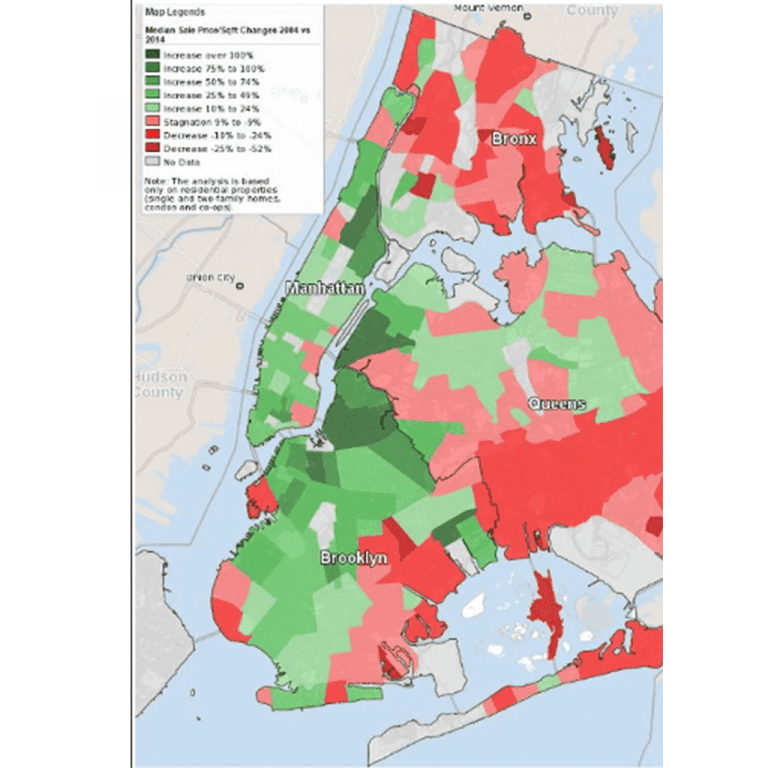
Neighborhoods within cities improve and decline at different rates. The graphic below (left) shows residential home price appreciation rates in the Greater New York City area from 2004-2014. The graphic to the right shows that while some areas (dark green) appreciated more than 100% (269% in Williamsburg, 132% in Long Island City, 102% in Harlem), others experienced much more modest appreciation rates (30-40% in much of Manhattan), and some experienced an overall decline in prices. All of these neighborhoods were subject to the same global, national, and metropolitan area economic conditions, so why do we have such disparity in appreciation rates in the same city?
Goal: Understanding how and why individual neighborhoods within metropolitan areas often move at different, and sometimes drastically different, levels of price appreciation.
Here we are gathering large amounts of alternative data on conditions within the city (311 calls, building permits, restaurant ratings, Yelp! Business data, FDIC deposit data, and transportation data, among others) to determine what factors influence this disparity in appreciation rates and whether or not these changes can be predicted.
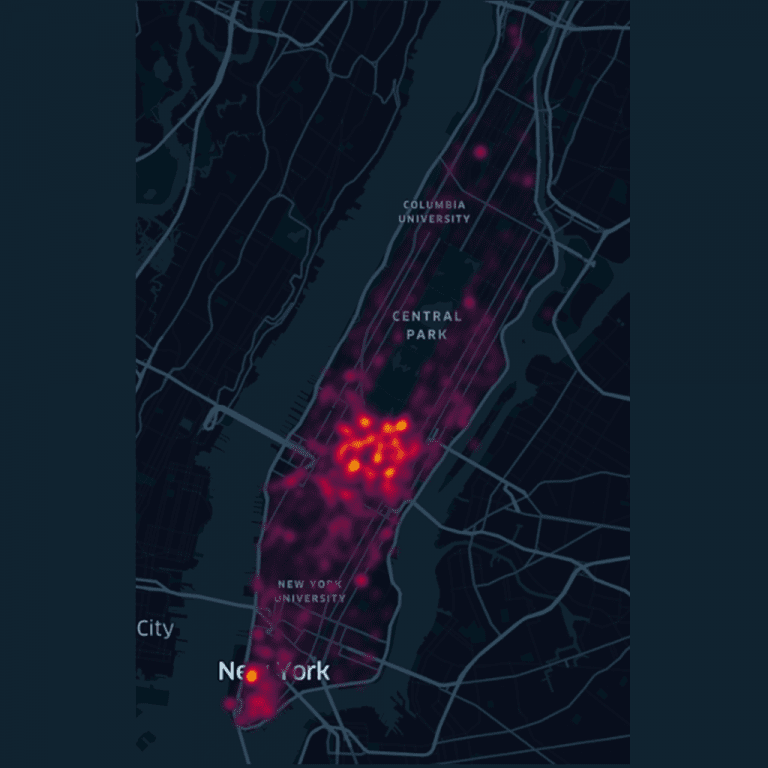
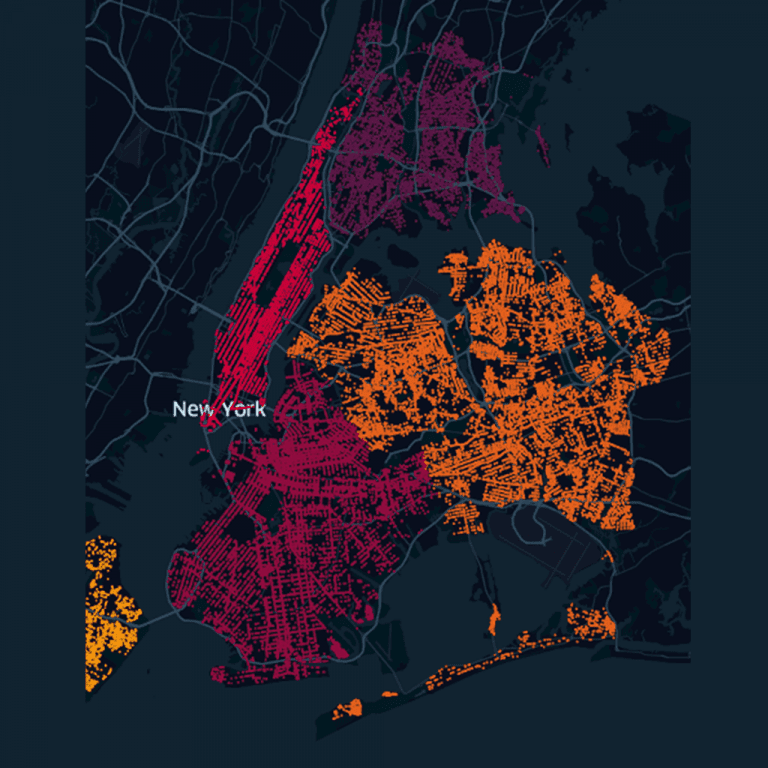
Mapping building permits by location and time allows us to visualize relative increases in clusters of building permits that are followed by increases in the valuation of properties in those areas within the next few years after the increased clustering is first noticed.
Previous
Next


